Embed Model-Driven App Charts in Power Pages with Liquid

In many real-world business scenarios, users need access to key insights—such as charts and trends—directly within a portal, without opening a model-driven app. Charts provide a powerful way to visualize Dataverse data and help users understand information quickly.
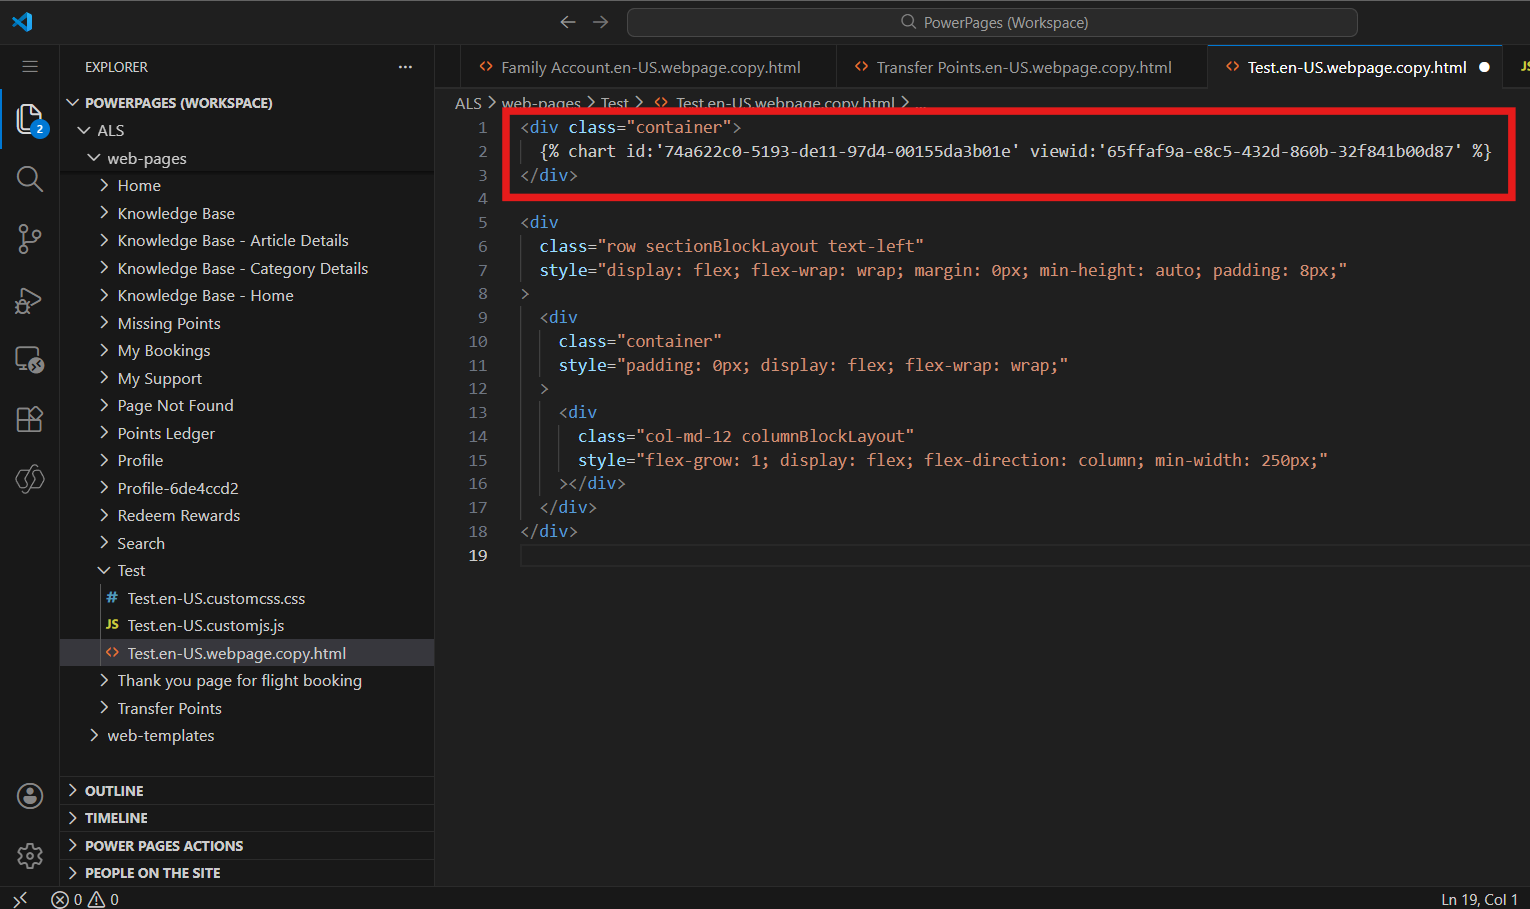
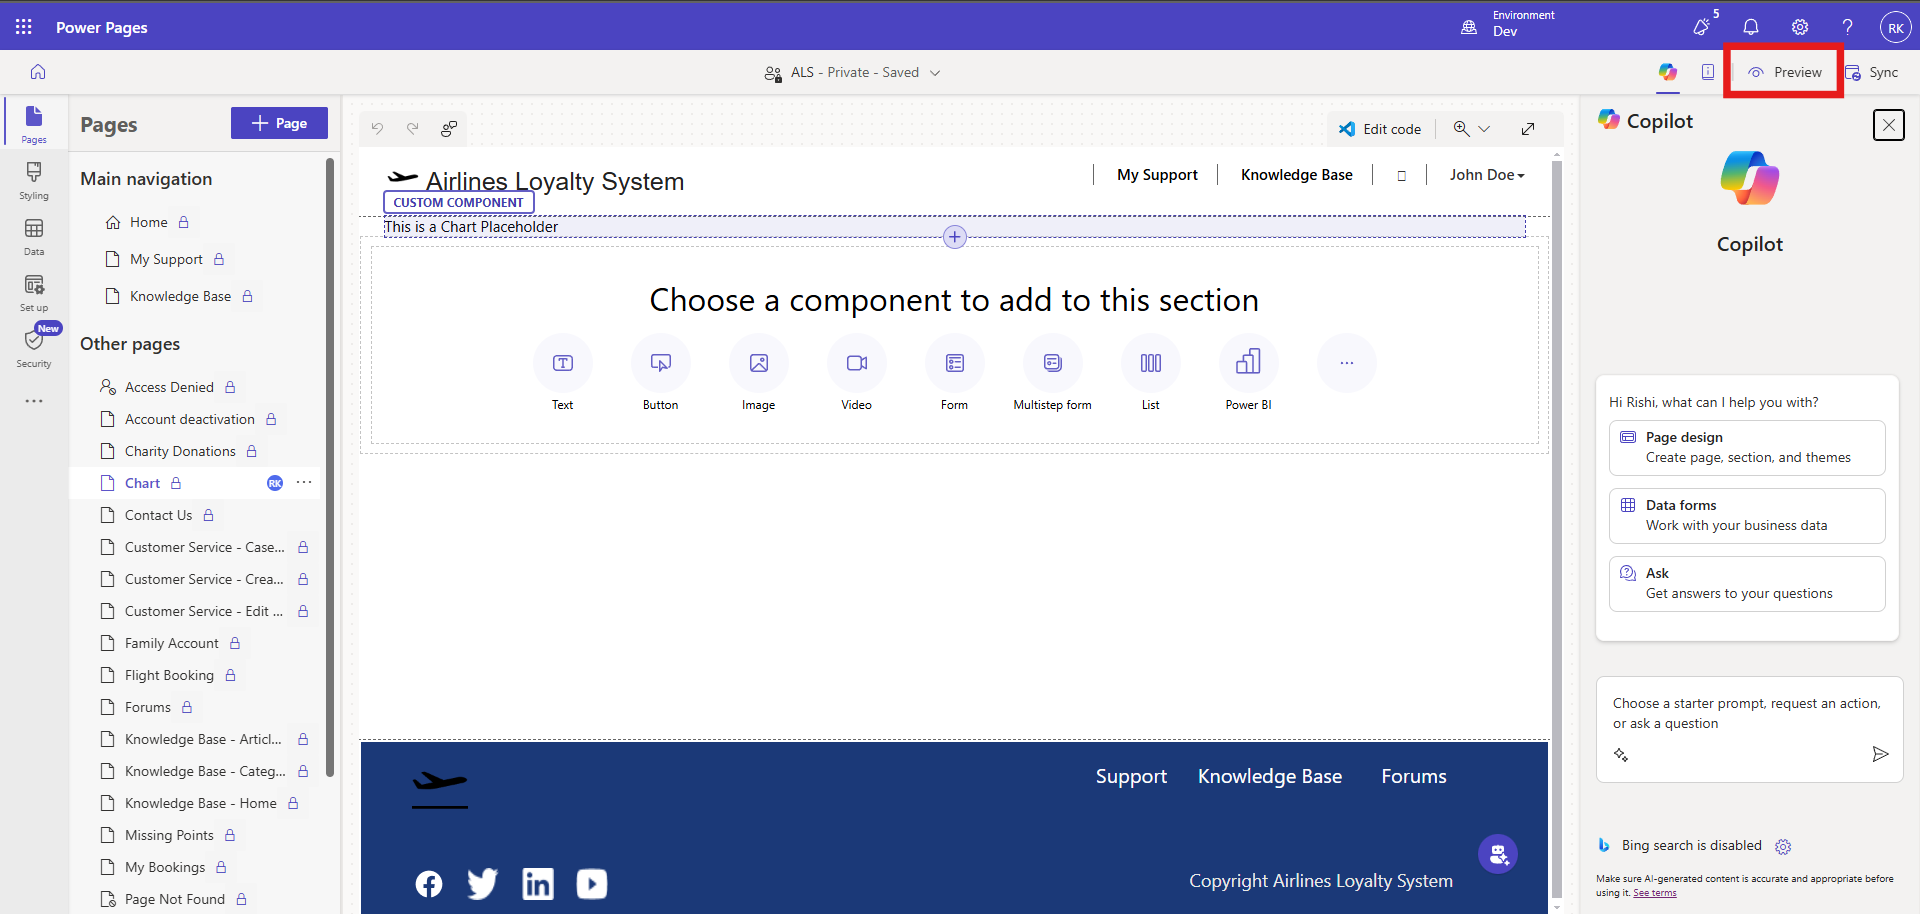
In this blog, you’ll learn how to embed a model-driven app chart into Power Pages using Liquid tags, allowing portal users to securely view real-time chart data on a webpage.
If you’re new to Liquid in Power Pages, you can check the official Microsoft documentation to understand how Liquid tags work.
Prerequisites
A Power Pages site (any template is fine)
A model-driven app
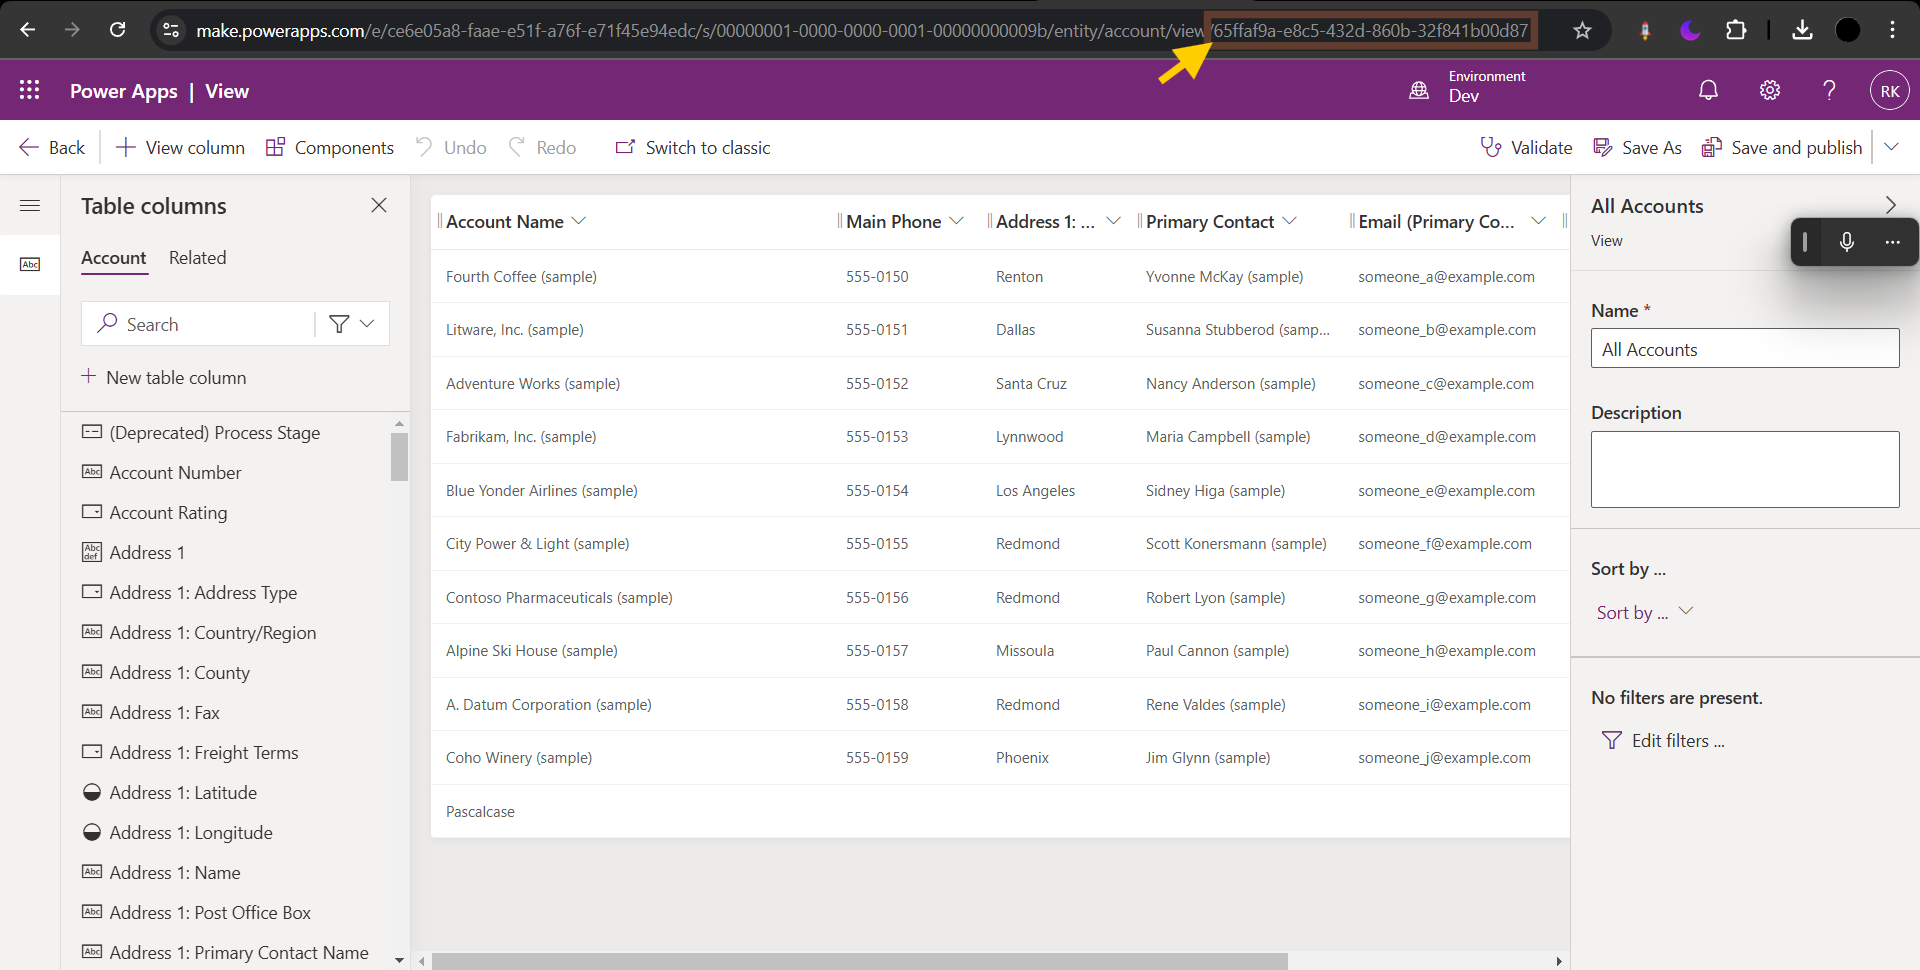
Access to make.powerapps.com (to get View ID)
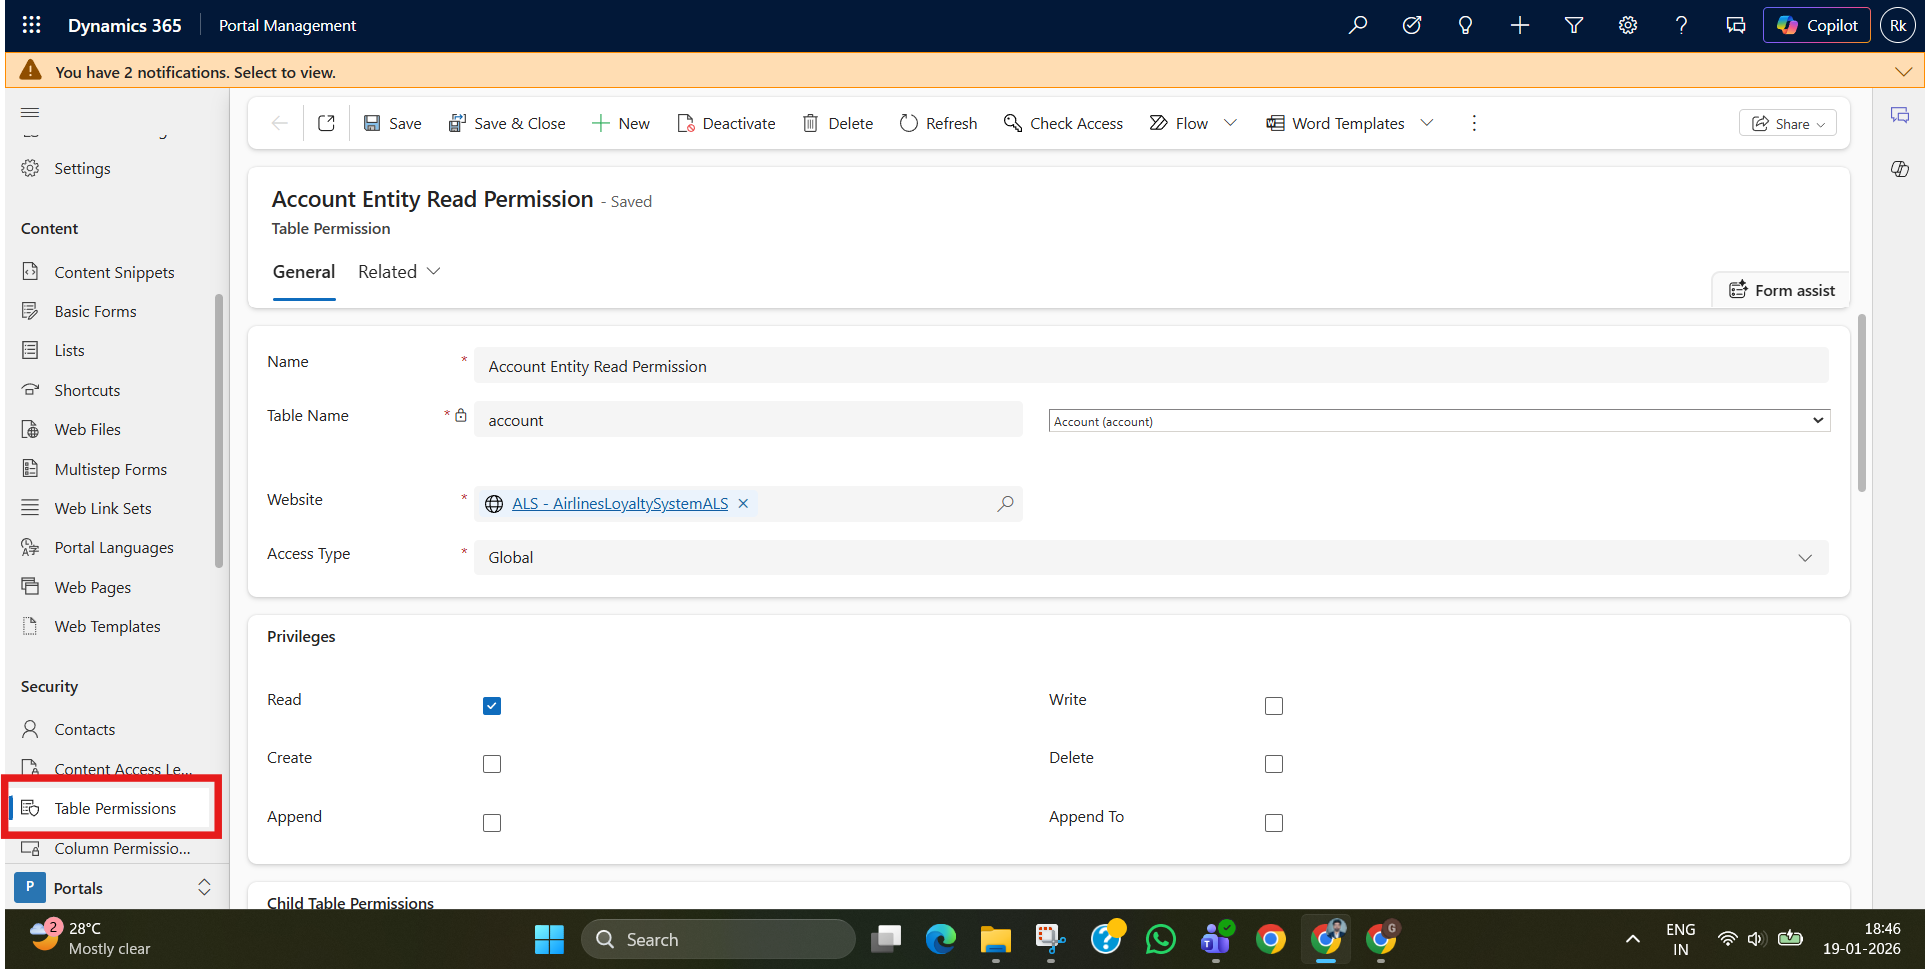
Proper Table Permissions + Web Roles configured in Power Pages (to avoid access denied)
Business Scenario
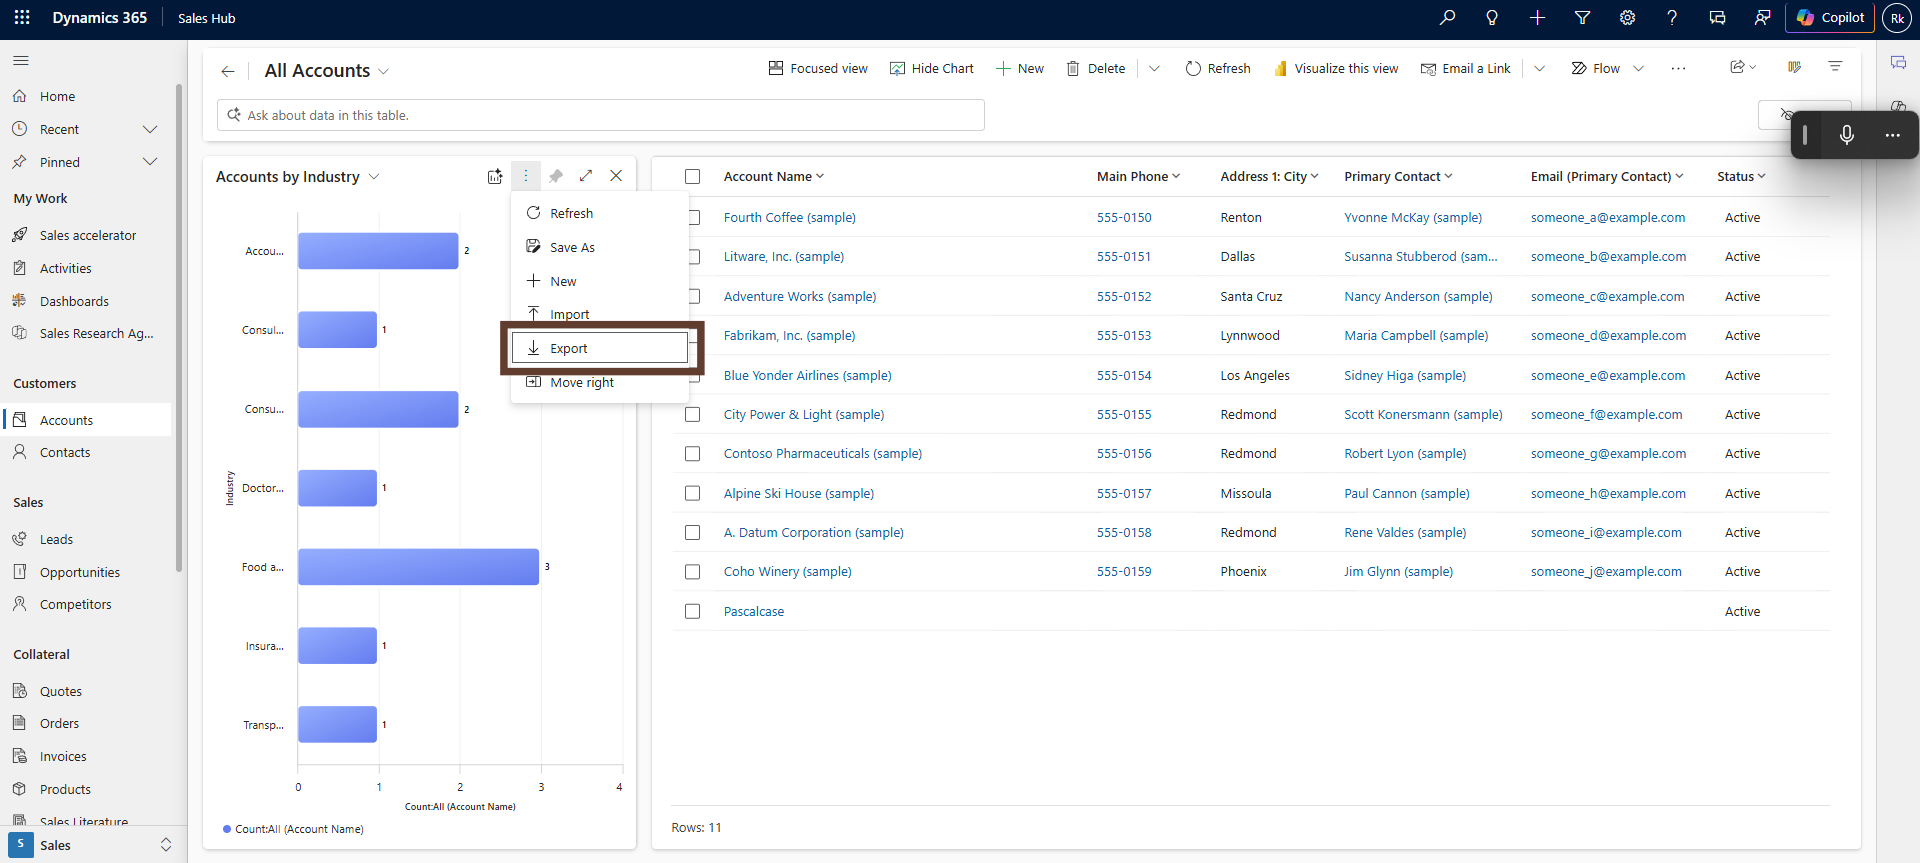
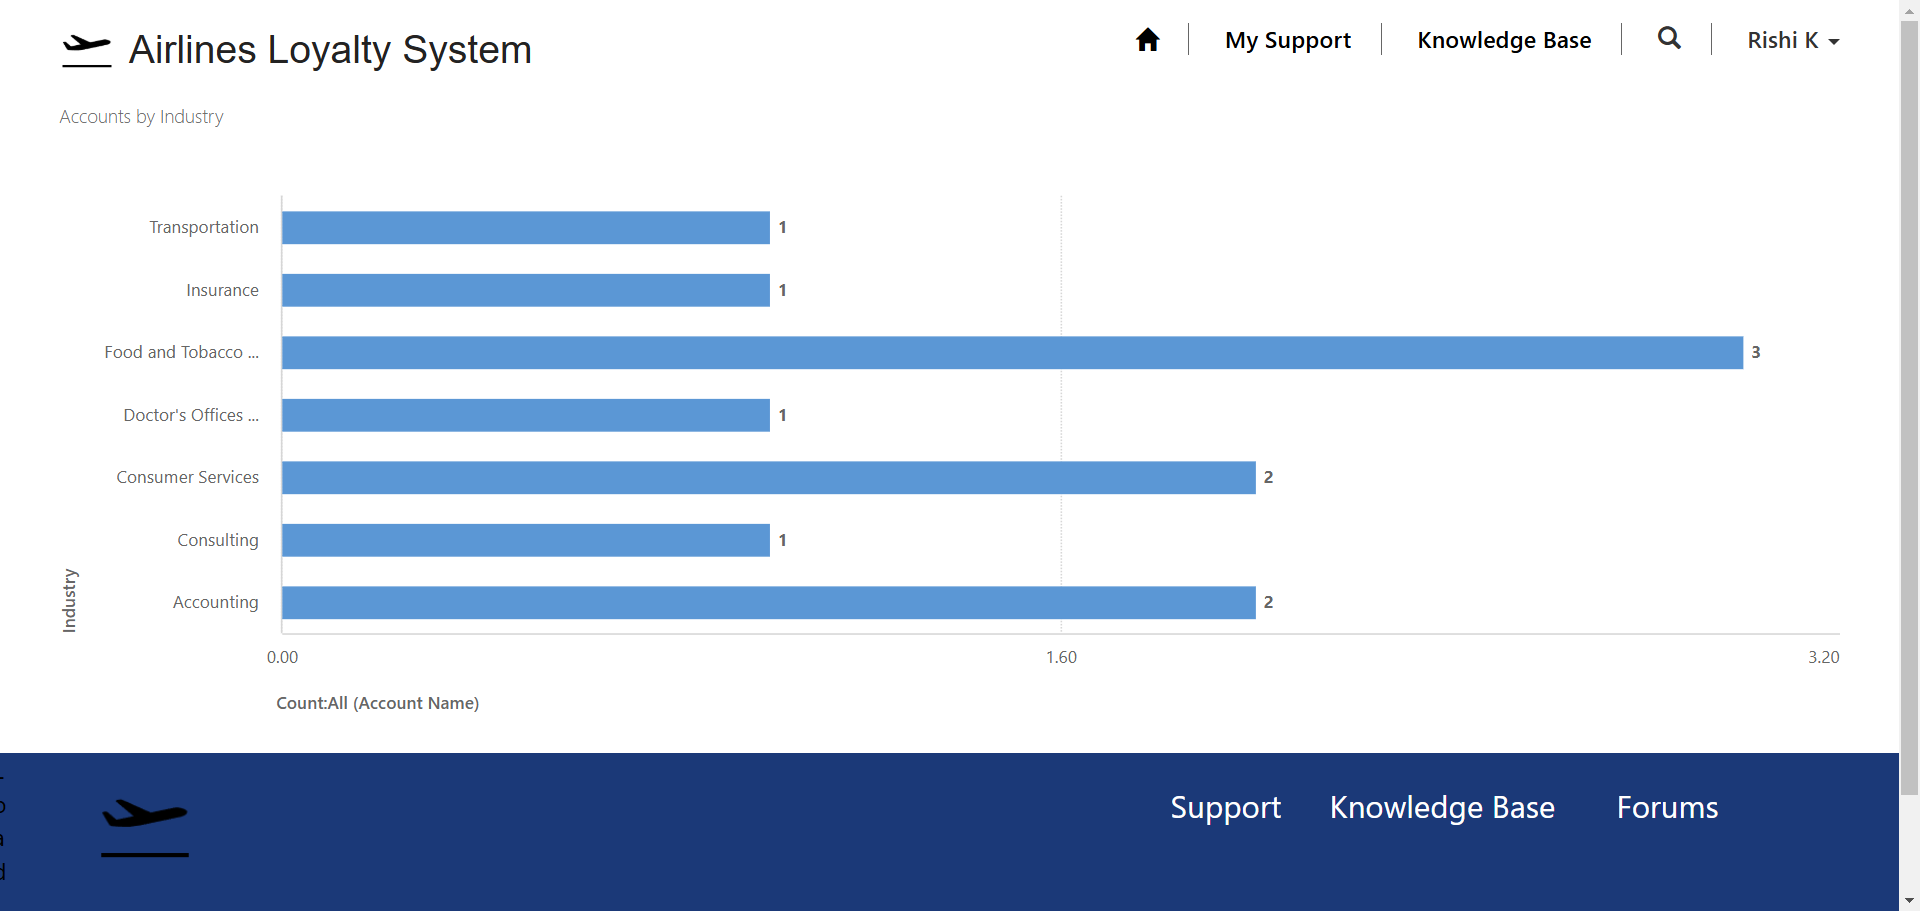
A company wants to provide its business partners with a high-level view of customer distribution by industry (e.g., Manufacturing, Healthcare, IT) through a Power Pages portal without granting direct access to the model-driven app.
By embedding an “Industry-wise Account Distribution” chart:
Partners gain instant insights.
Stakeholders view real-time customer segmentation.
Data access remains secure through Power Pages permissions.
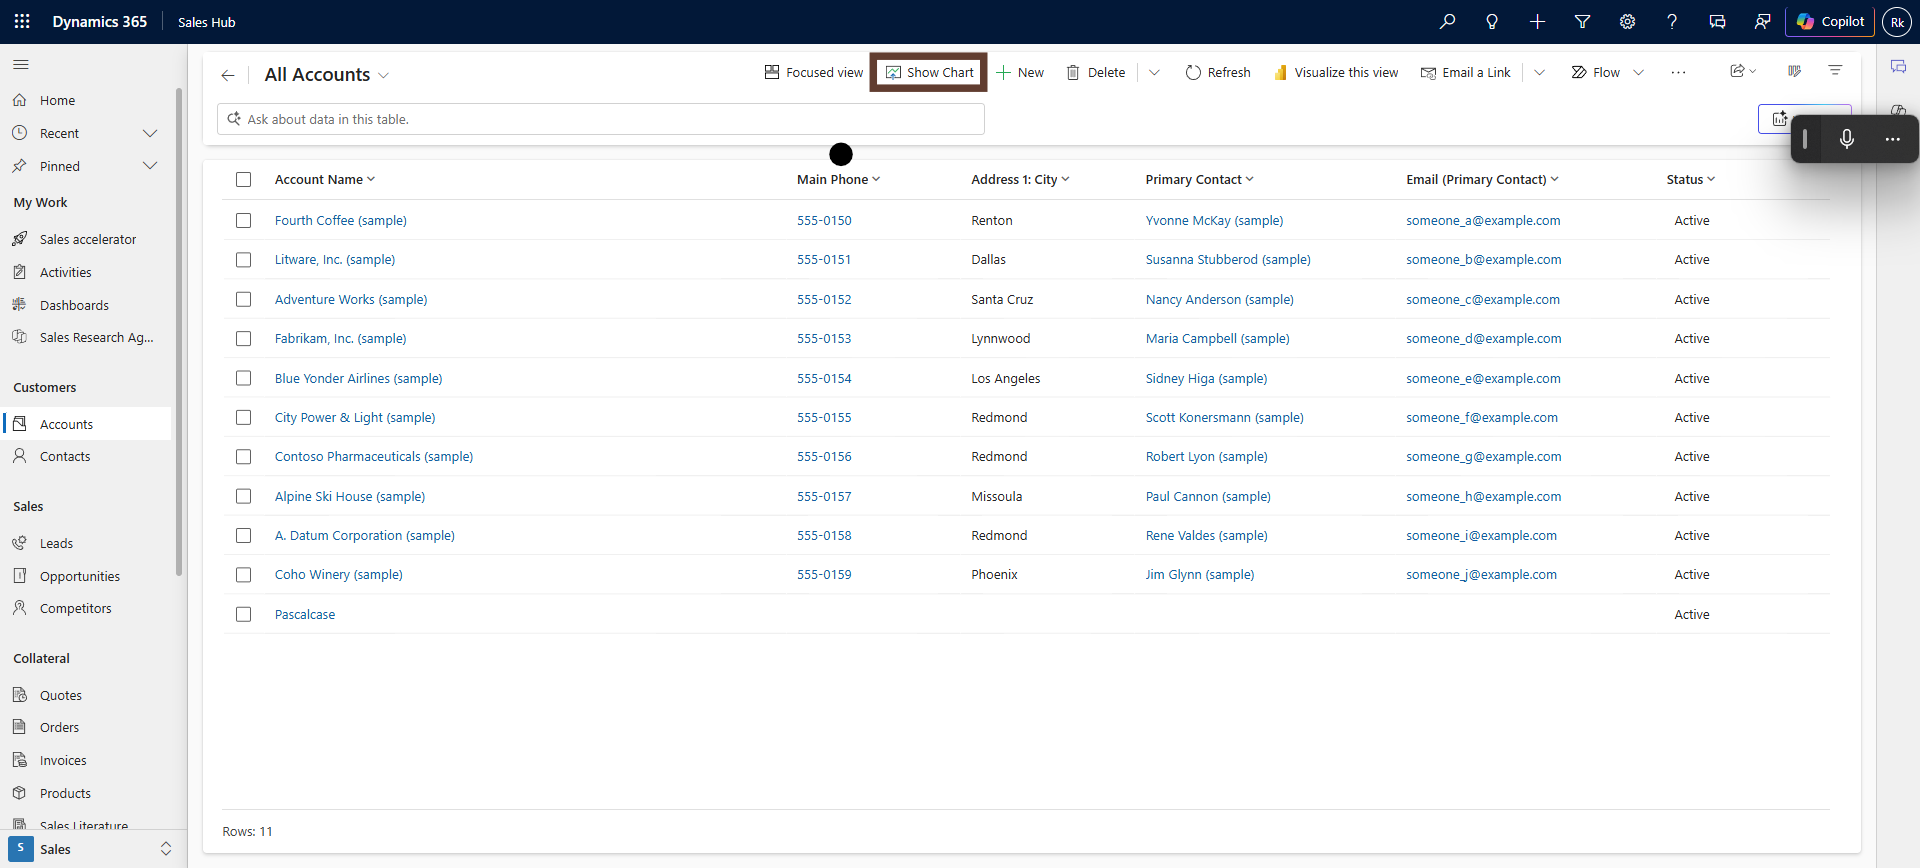
Step-By-Step Guide
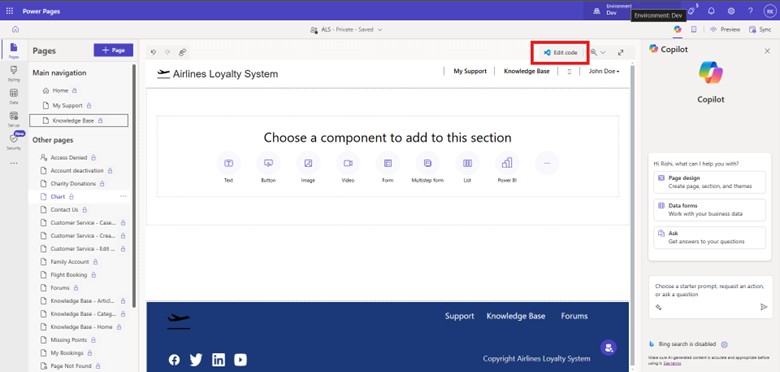
In the model-driven app, navigate to the target entity and click .