LogoLogo

Our Products

Metadata Browser

Edge Add-on

HTML To PDF Converter

Power Automate Connector

Data Mask for Dataverse

Dataverse App

Commission 365

Dynamics 365 App

AI Autocloser

Dataverse App

Flow Monitor

Power Automate App

ServicesAboutCareersBlogContact
Chat on Teams
Metadata BrowserHTML To PDF ConverterData Mask for DataverseCommission 365AI AutocloserFlow Monitor
ServicesAboutCareersBlogContactChat on Teams
HomeBlogDebug a model-driven app with Power Apps Monitor

Debug a model-driven app with Power Apps Monitor

September 29, 2024
#Power Apps
Chetan Jha
Debug a model-driven app with Power Apps Monitor

As businesses rely more on Power Apps model-driven applications to boost efficiency, keeping them running smoothly is essential. As these apps become more complex, real-time monitoring of their performance becomes even more important. Power Apps Monitor is a helpful tool that provides insights into app performance, user activity, and key events.  

In this blog, we'll explore how Power Apps Monitor helps improve model-driven applications and how it can be used to diagnose and fix problems effectively. 

What is Power Apps Monitor? 

Power Apps Monitor is an inbuilt tool for debugging and analysing app behaviour and performance within model-driven app. It helps app makers, developers, and administrators track key metrics like load times, API requests, and performance bottlenecks in real time. This comprehensive view aids in identifying areas where apps may need optimization, ensuring a seamless user experience. 

Key Features of Power Apps Monitor 

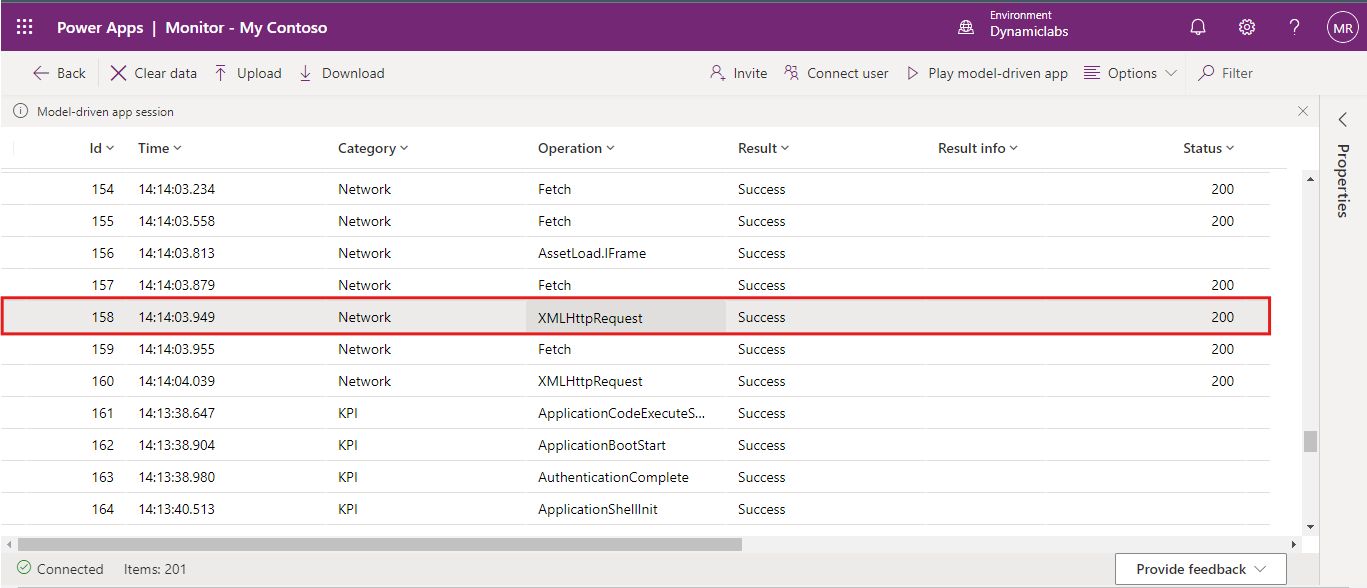
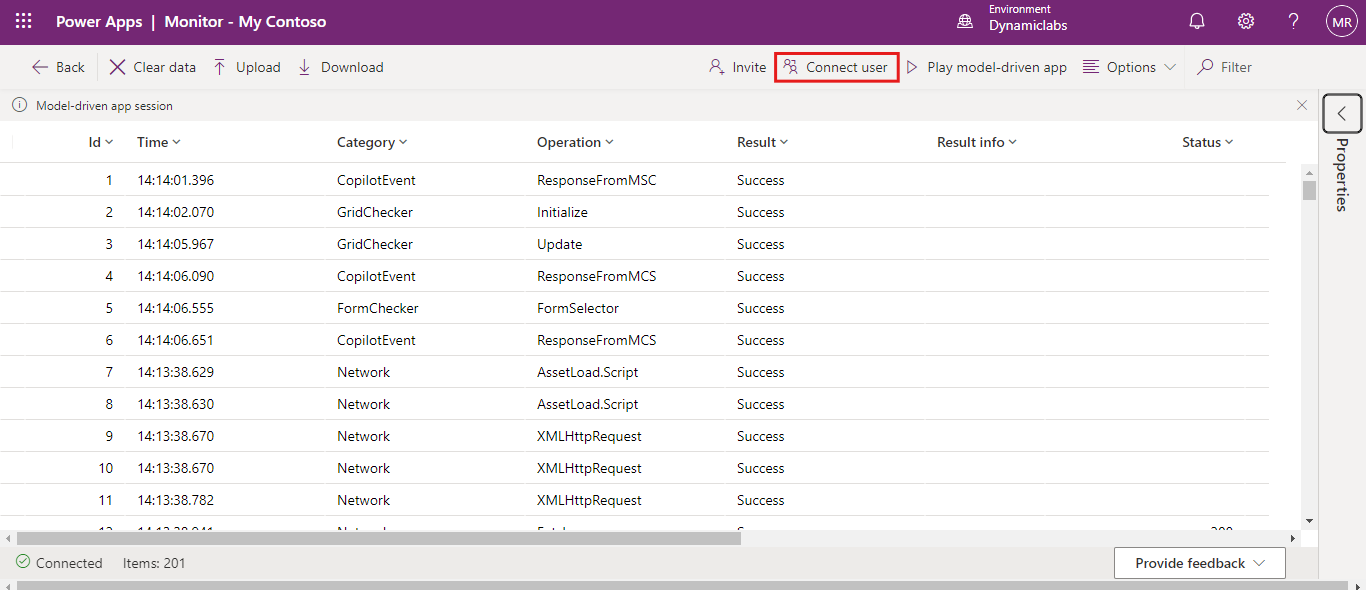
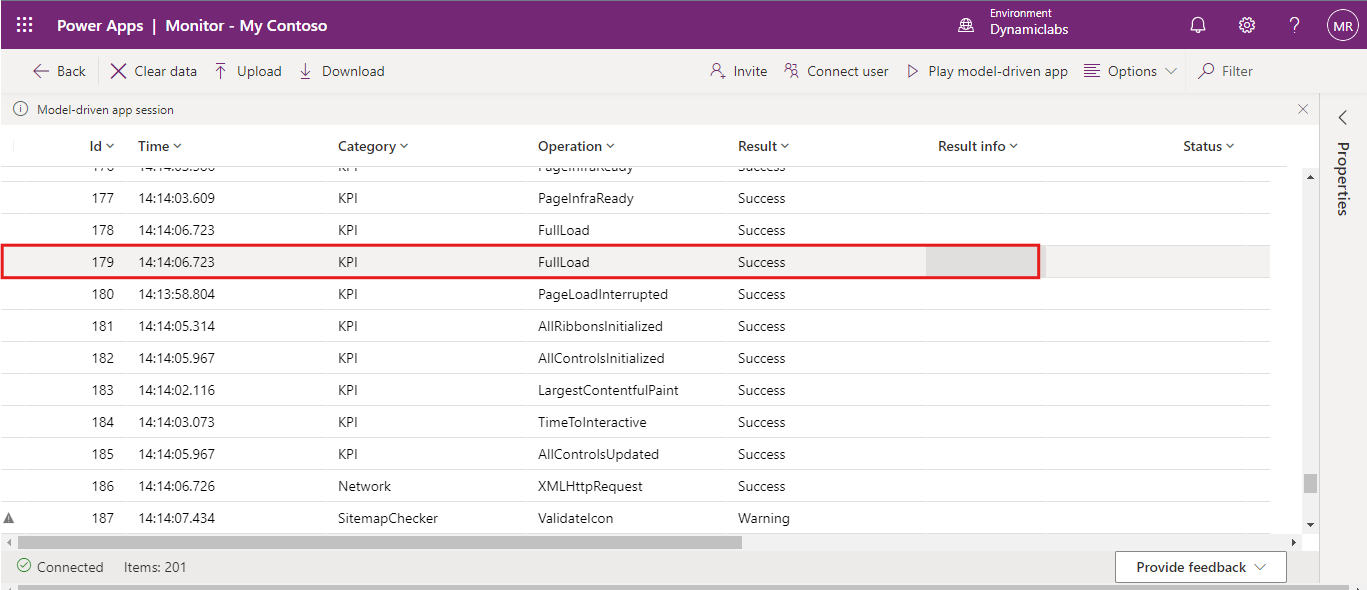
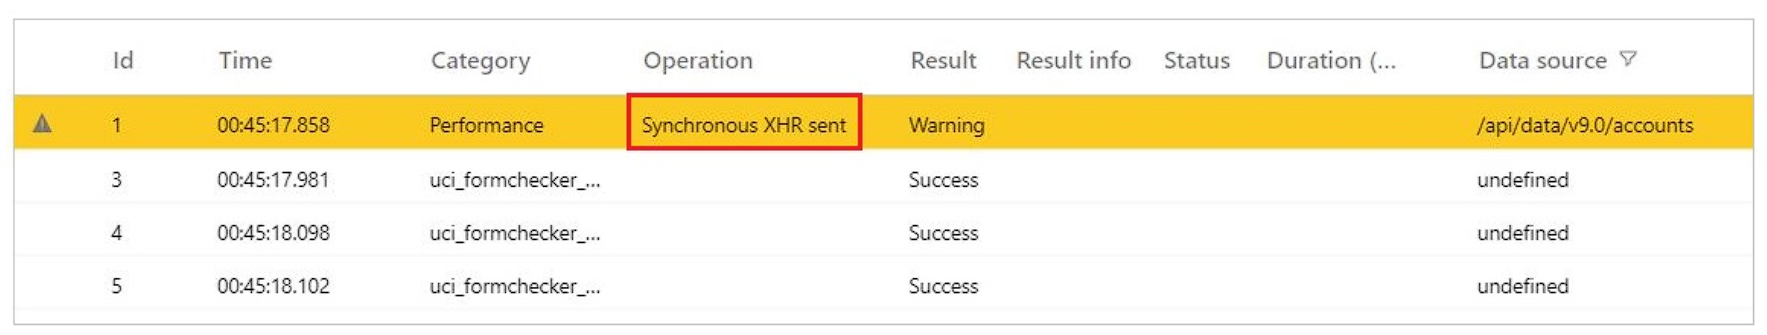
1. Live Tracing: Power Apps Monitor captures user interactions, providing a trace of app events and the flow of actions. For example, if an app is slow to load a page, you can view all actions triggered by the user and identify the cause of the delay. 

2. Event Logs: With detailed logs of events such as form loads, data fetches, and API calls, Power Apps Monitor helps you track down errors and slow processes, enabling timely fixes. 

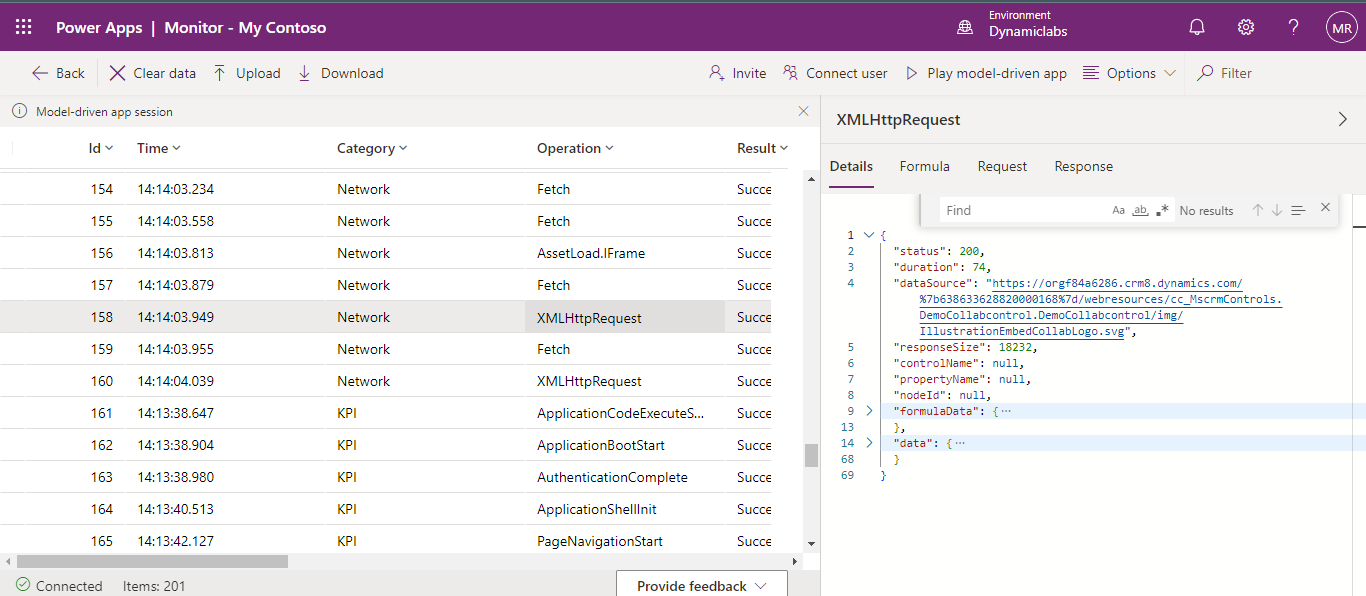
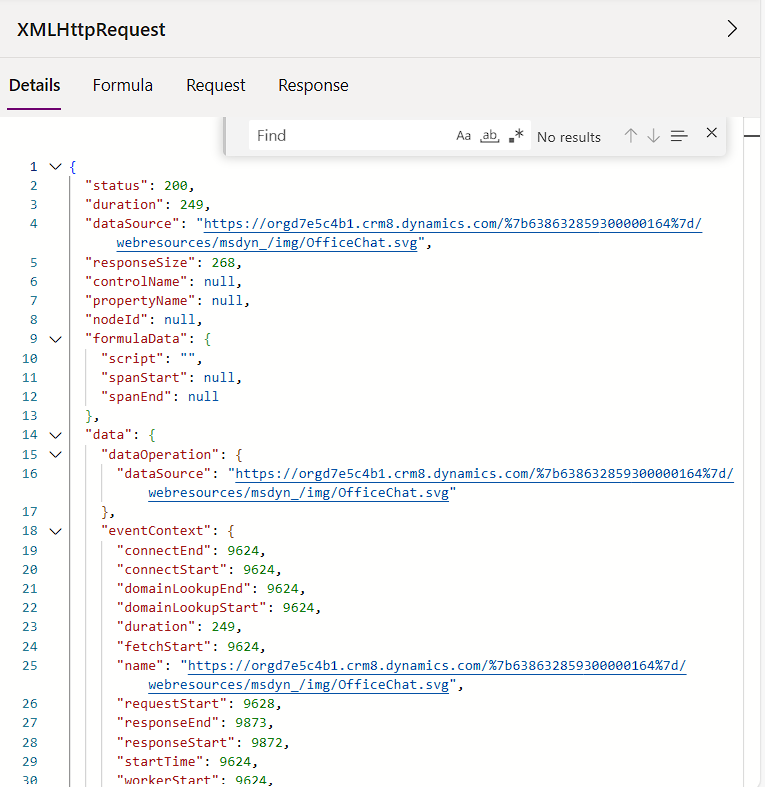
3. API and Network Monitoring: Monitor API calls and network requests within your app. The tool shows request timings, response codes, and payloads, helping diagnose issues with third-party integrations or system backends. 

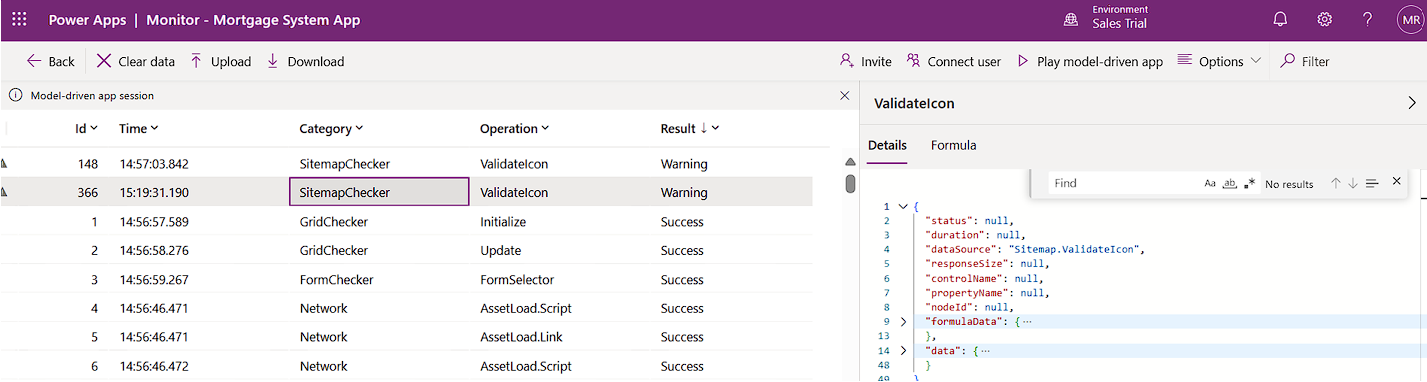
4. App Diagnostics: It offers detailed information on app session details, user behaviour, and system events, helping to maintain app quality and responsiveness. 

5. Filtering & Search Capabilities: Power Apps Monitor allows you to filter and search for specific events or errors, making it easier to focus on high-priority issues. 

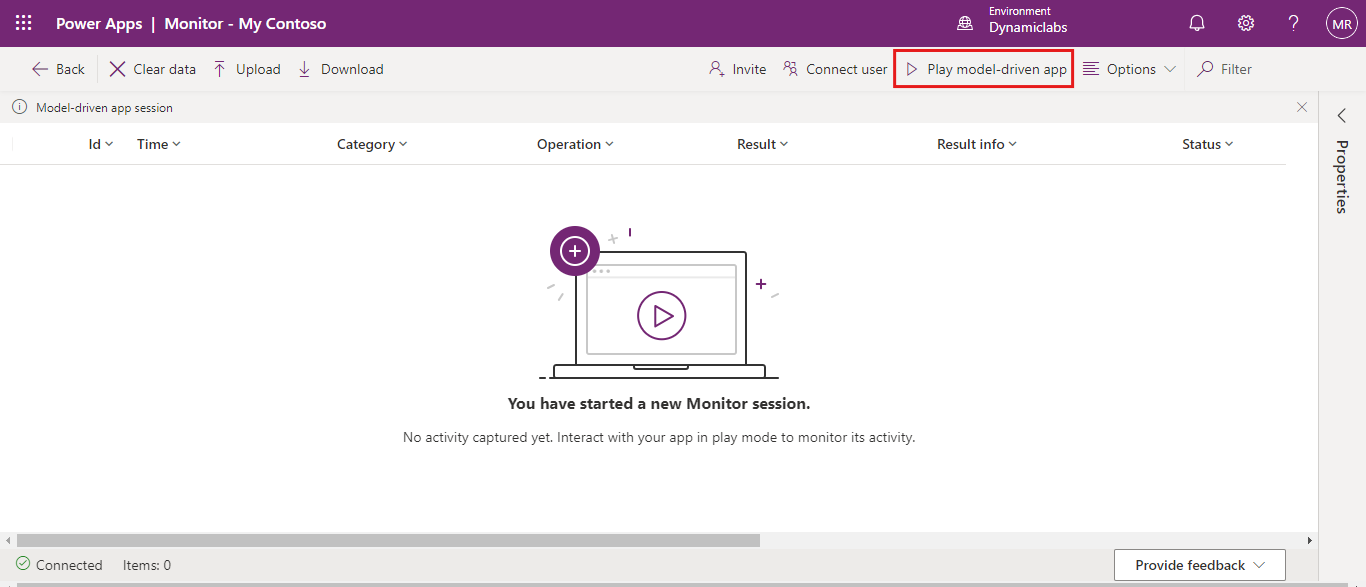
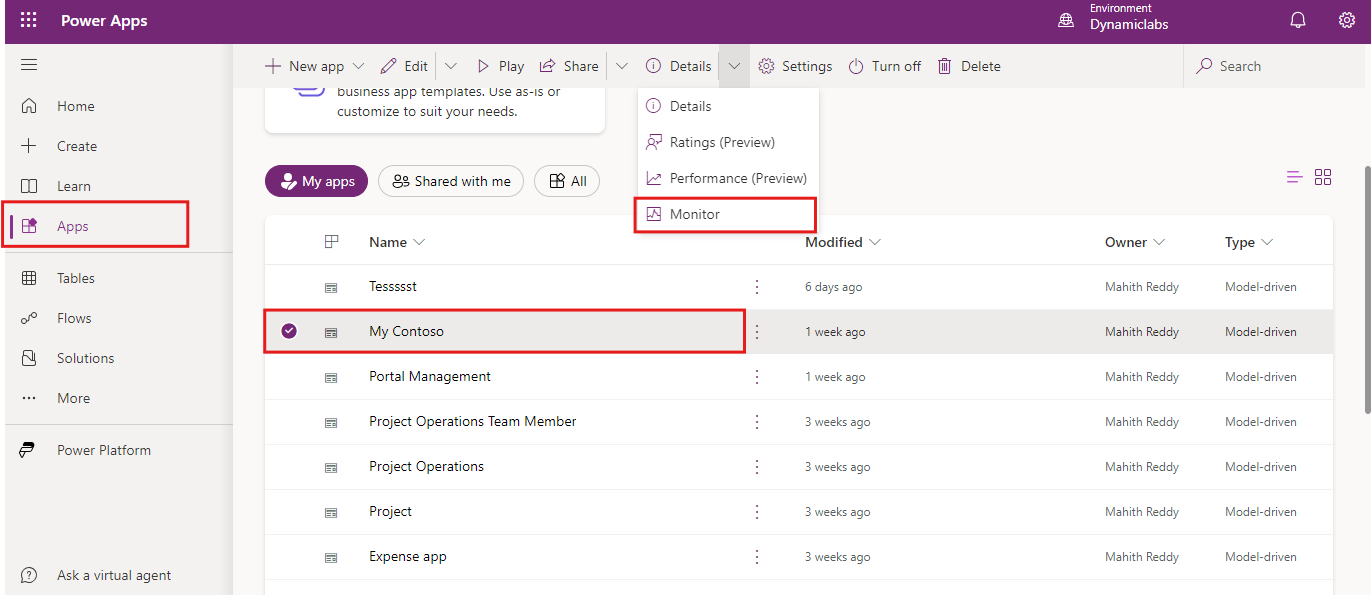
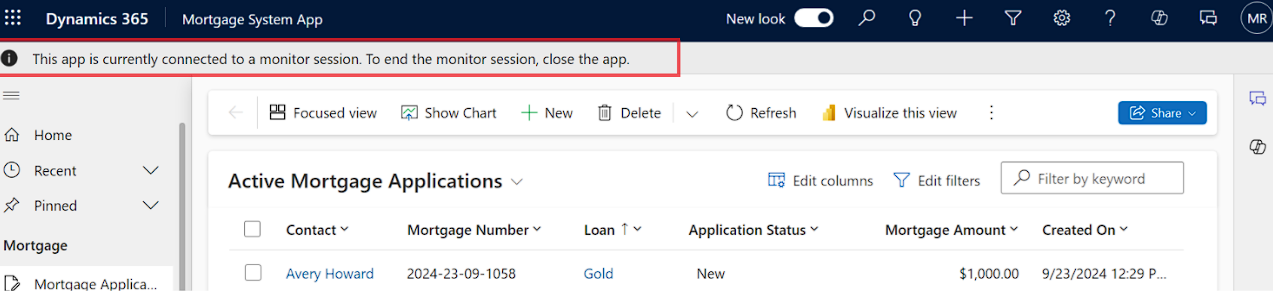
Steps to use Monitor to diagnose a model-driven app: 

Sign into Power Apps, and then select  from the left navigation pane. 

Back to all articles

More from the blog

Creating and managing topics in Copilot Studio with Power Apps integration

Automate Image Data Extraction Using Power Apps and AI

Creating a Loading Animation in Power Apps

Creating Virtual Tables in Power Apps using Share Point Connector

Creating an App from Figma in Power Apps

How to Create Custom Connectors in Power Apps?

Implementing Catalog Manager: A Step-by-Step Guide in Power Apps

How to Install Catalog Manager in Power Apps?

Need help with your business solution?

Our team can help you implement the right solution for your organization.

Get in touch
LogoLogo

Ex-Microsoft experts helping businesses get more from their Dynamics 365 and Power Platform investments.

Products

Apps

Select the model-driven app that you want to monitor, and then select Monitor on the command bar. 

Debug a model-driven app with Power Apps Monitor 01

In the web page that opens, select Play model-driven app to open your app 

Debug a model-driven app with Power Apps Monitor 02

After the app is opened from Monitor, you’ll see a Join monitor debug session dialog box. This lets you know that any data from the app will be sent to the Monitor owner. Select Join. Events begin to flow to the Monitor session screen as they occur in the app.

Debug a model-driven app with Power Apps Monitor 03
Debug a model-driven app with Power Apps Monitor 04

Select an event to display additional information in the right pane. 

Debug a model-driven app with Power Apps Monitor 05

Invite Users to your Debug session 

Open the app's Monitor tool by clicking "Monitor" in Power Apps 

Debug a model-driven app with Power Apps Monitor 06

In the Monitor, if you want to connect user then choose connect user option. 

Debug a model-driven app with Power Apps Monitor 07

Now search for the user to whom you want to generate the a join link.

Debug a model-driven app with Power Apps Monitor 08

Copy the invitation link and send it to the collaborators you want to invite via email, chat, or any preferred communication platform. This link provides direct access to your live session. 

Debug a model-driven app with Power Apps Monitor 09

Once users click the link and join the session, they can actively participate in the debugging process. You can track their actions, including any issues or errors that occur as they interact with the app, allowing for efficient collaboration in diagnosing and resolving problems. 

Debug a model-driven app with Power Apps Monitor 10

FullLoad Event 

The FullLoad event measures the total time taken to load a page, including data retrieval and custom scripts. This helps developers understand where delays occur in the app loading process and pinpoint performance bottlenecks. 

Debug a model-driven app with Power Apps Monitor 11

Network Events 

Network-related issues such as failed or slow API calls are tracked to assess connectivity problems or latency affecting app performance. Monitor provides details on HTTP status codes, request payloads, and response times for each network request. 

Debug a model-driven app with Power Apps Monitor 13

Custom Script Errors 

If the app has custom JavaScript, errors from these scripts are logged with detailed information about the error type, location, and stack trace. This is useful for debugging JavaScript logic that may affect user experience or app functionality. 

Debug a model-driven app with Power Apps Monitor 14

Slow Performance Indicators 

Monitor flags events where performance is significantly slower than expected. These could be due to long database queries, inefficient network requests, or heavy custom script execution. Developers can use this insight to optimize data fetching, minimize script size, or adjust logic to enhance responsiveness. 

Debug a model-driven app with Power Apps Monitor 15

By leveraging the features of Power Apps Monitor, you can build better, faster, and more resilient model-driven apps. Whether you're a developer, administrator, or business user, integrating Power Apps Monitor into your workflow is a game changer for maintaining app performance and delivering value to end users. 

Frequently Asked Questions (FAQs): 
1. What is the purpose of Monitor? 

Monitor helps debug and diagnose issues in model-driven apps, providing a detailed log of app activities. 

2. How can you start a monitoring session? 

Sign in to Power Apps, select your app, and click on Monitor in the command bar. Alternatively, add &monitor=true to the app's URL. 

3. What types of events does Monitor track? 

Monitor tracks page navigation, command executions, form saves, and key performance indicators. 

4. What information does the FullLoad event provide? 

It details the complete loading of a page, including loading time and custom script execution statistics. 


Metadata Browser
  • HTML To PDF Converter
  • Data Mask for Dataverse
  • Commission 365
  • AI Autocloser
  • Flow Monitor
  • Services

    • D365 Marketing
    • D365 Sales
    • D365 Customer Service
    • D365 Field Service

    Company

    • About Us
    • Blog
    • Contact
    • Careers

    Copyright ©2026 Pascalcase Software Private Limited. All rights reserved.

    Privacy PolicyTerms of Service