In many real-world business scenarios, users need access to key insights—such as charts and trends—directly within a portal, without opening a model-driven app. Charts provide a powerful way to visualize Dataverse data and help users understand information quickly.
In this blog, you’ll learn how to embed a model-driven app chart into Power Pages using Liquid tags, allowing portal users to securely view real-time chart data on a webpage.
If you’re new to Liquid in Power Pages, you can check the official Microsoft documentation to understand how Liquid tags work.
Prerequisites
A Power Pages site (any template is fine)
A model-driven app
Access to make.powerapps.com (to get View ID)
Proper Table Permissions + Web Roles configured in Power Pages (to avoid access denied)
Business Scenario
A company wants to provide its business partners with a high-level view of customer distribution by industry (e.g., Manufacturing, Healthcare, IT) through a Power Pages portal without granting direct access to the model-driven app.
By embedding an “Industry-wise Account Distribution” chart:
Partners gain instant insights.
Stakeholders view real-time customer segmentation.
Data access remains secure through Power Pages permissions.
Step-By-Step Guide
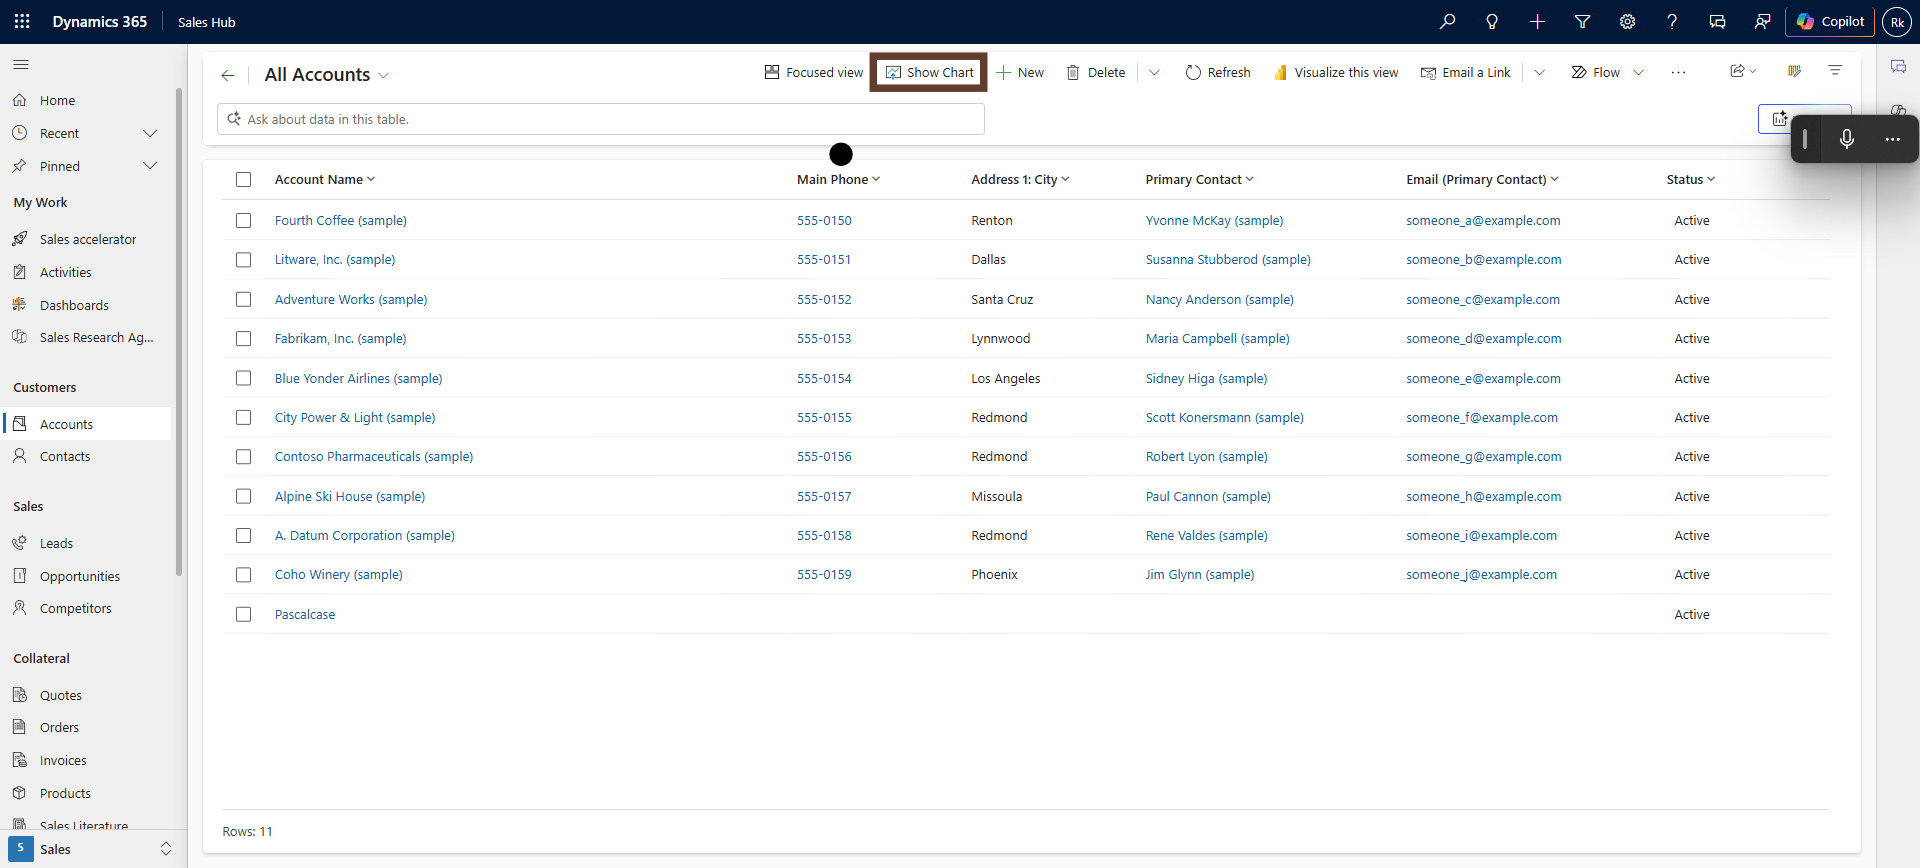
In the model-driven app, navigate to the target entity and click Show charts.
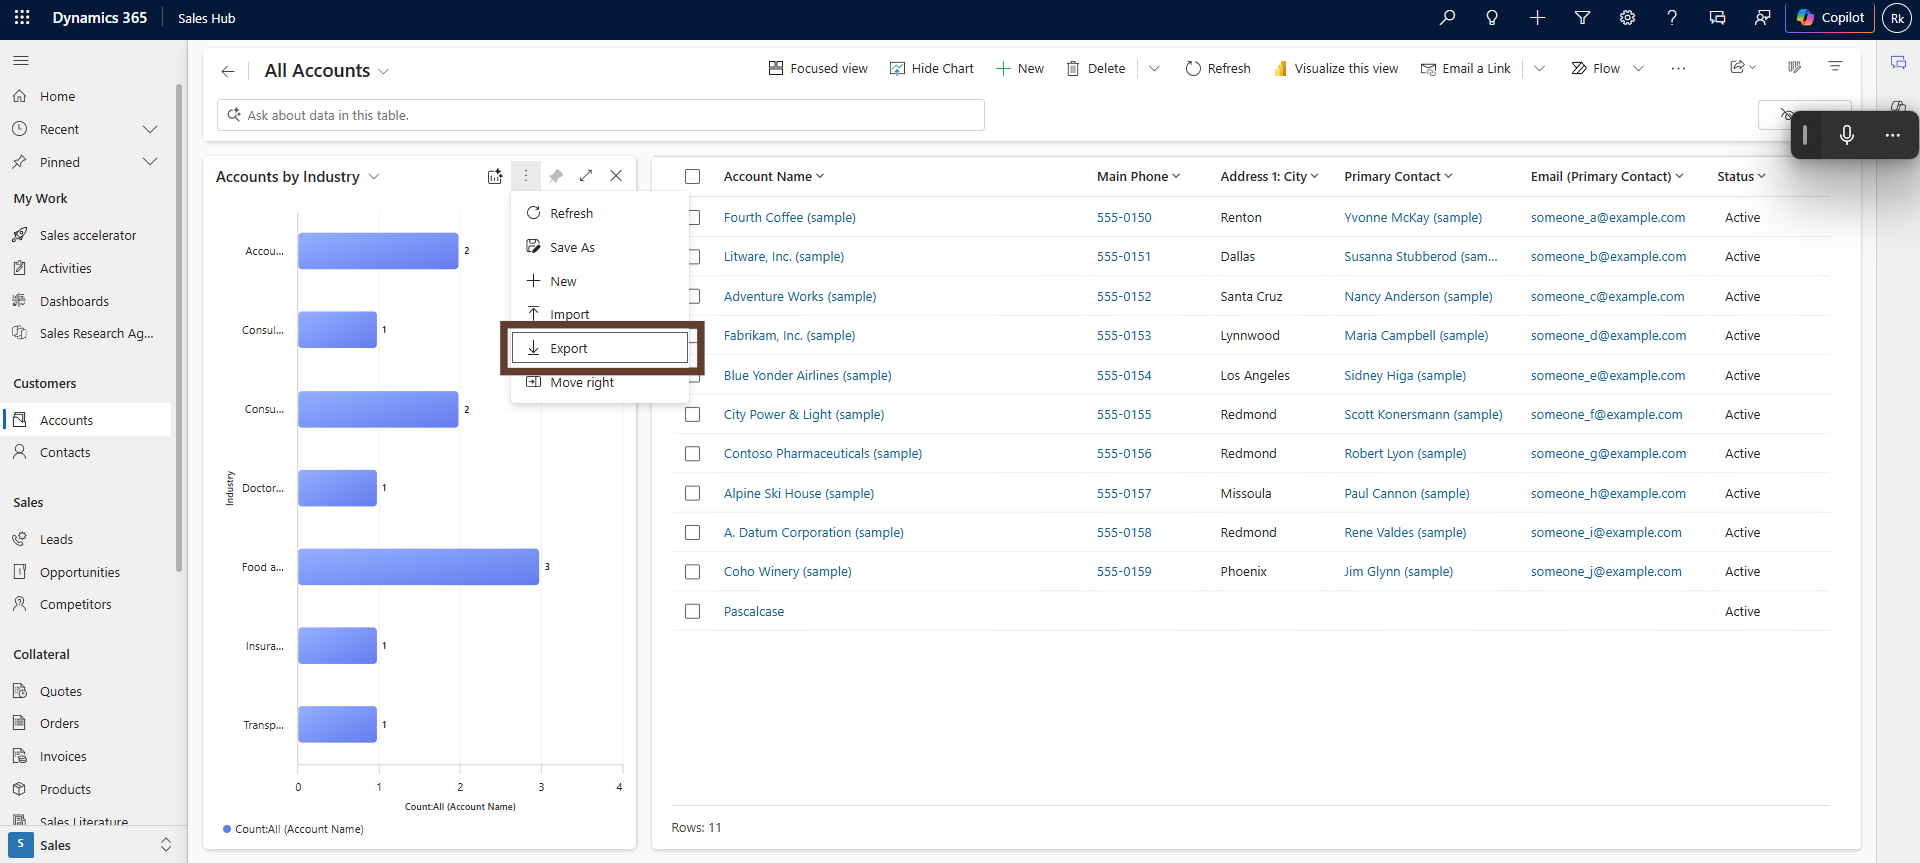
Choose the chart you want to display, click More commands (⋯), and select Export Chart (this downloads an XML file).
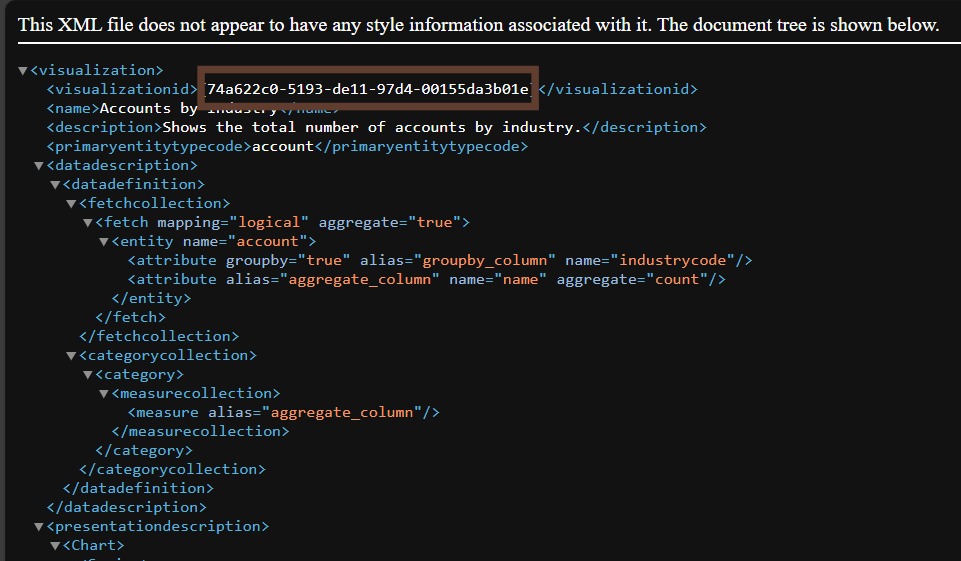
Open the exported XML file and copy the GUID inside the <visualizationid> tag — this is your Chart ID.
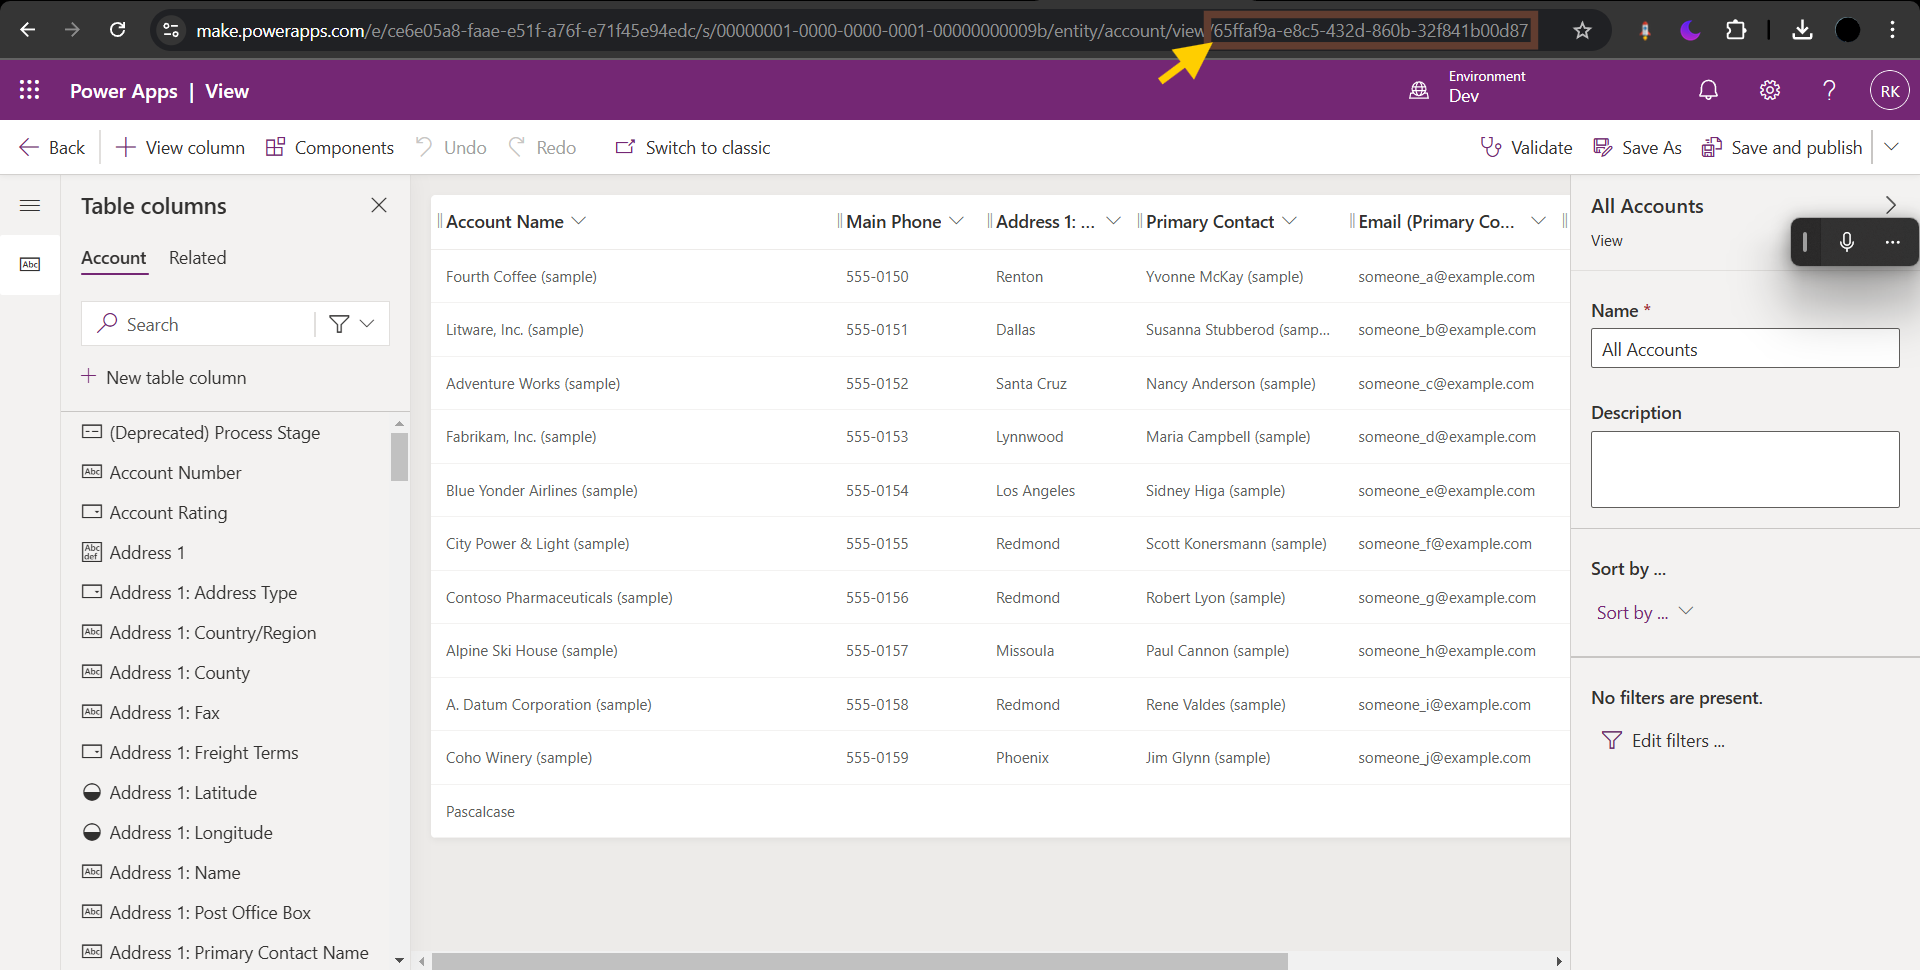
Go to make.powerapps.com → Tables → Open your table → Views → Open the view you want (example: Active Records). Copy the GUID from the URL — that is your View ID.
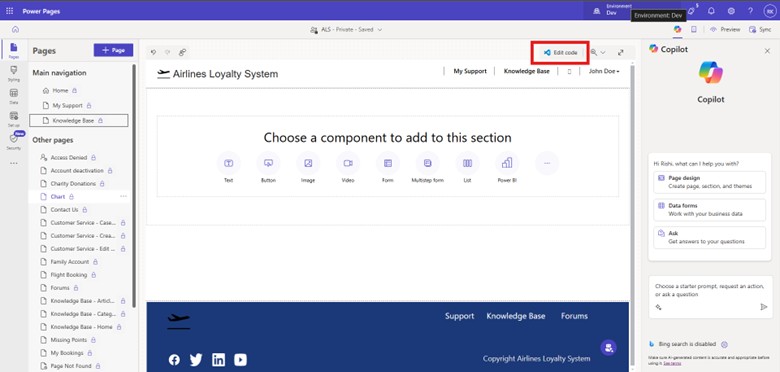
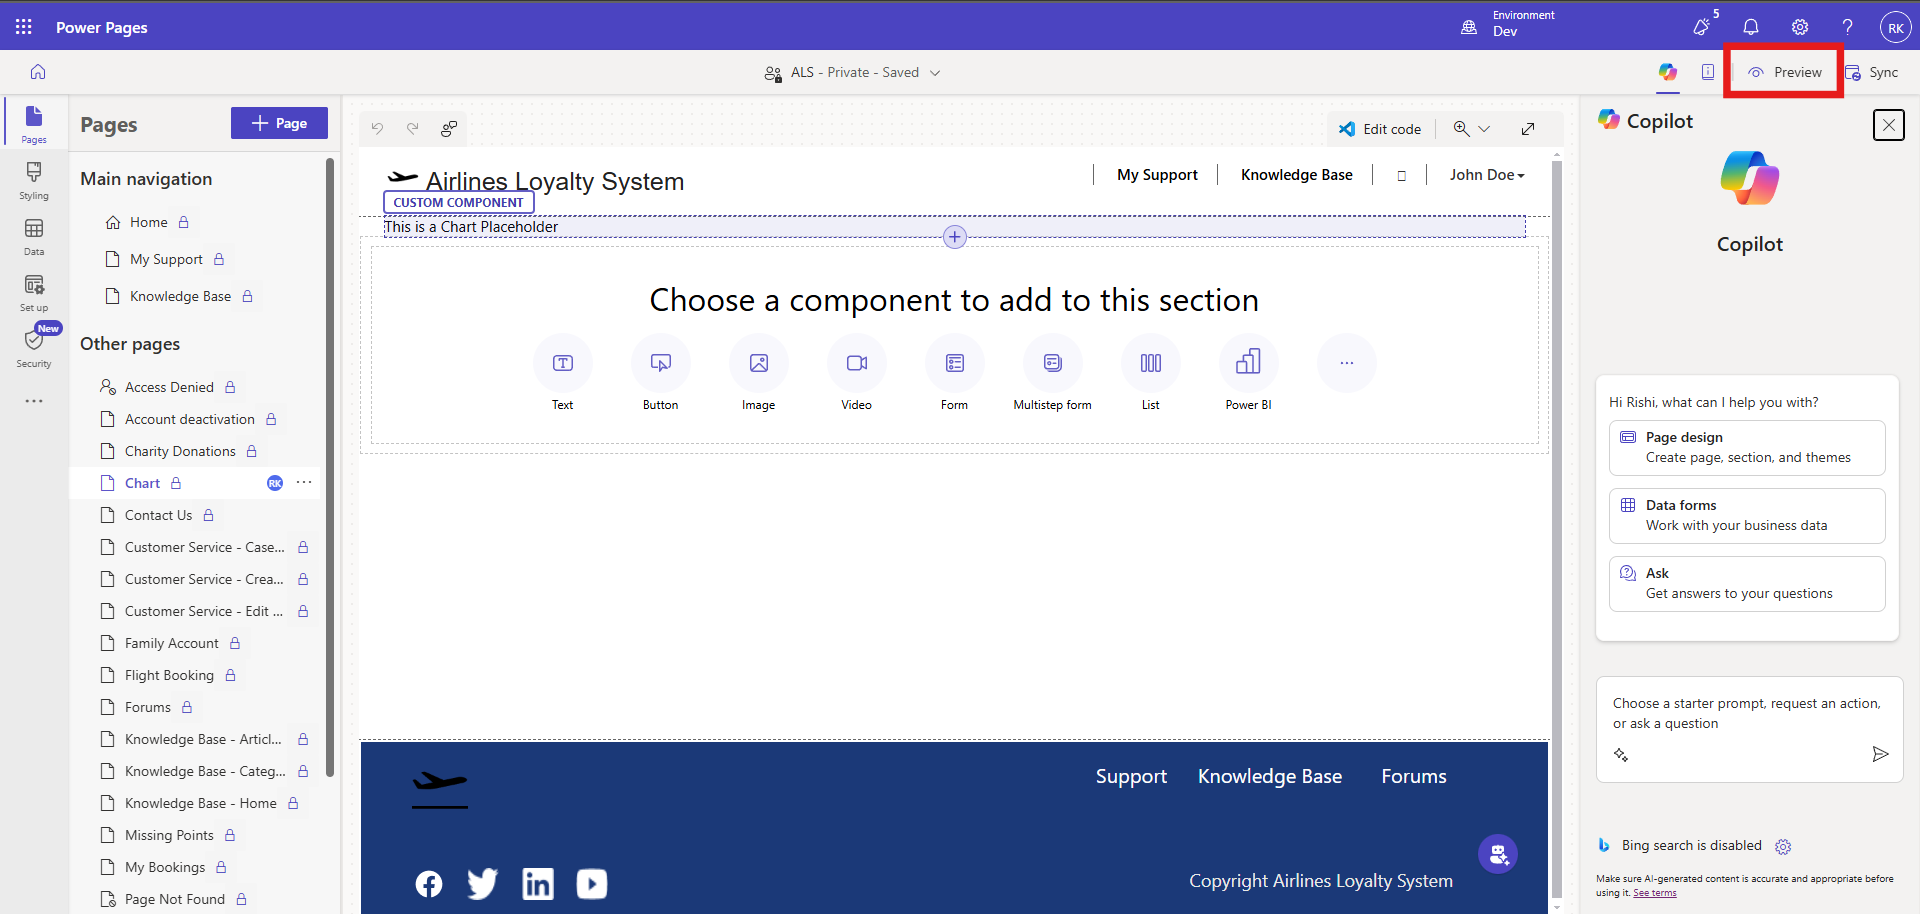
In Power Pages, I created a portal using a predefined template. To start editing, open your site in Power Pages Design Studio and click Edit code (this opens the site in Visual Studio Code).
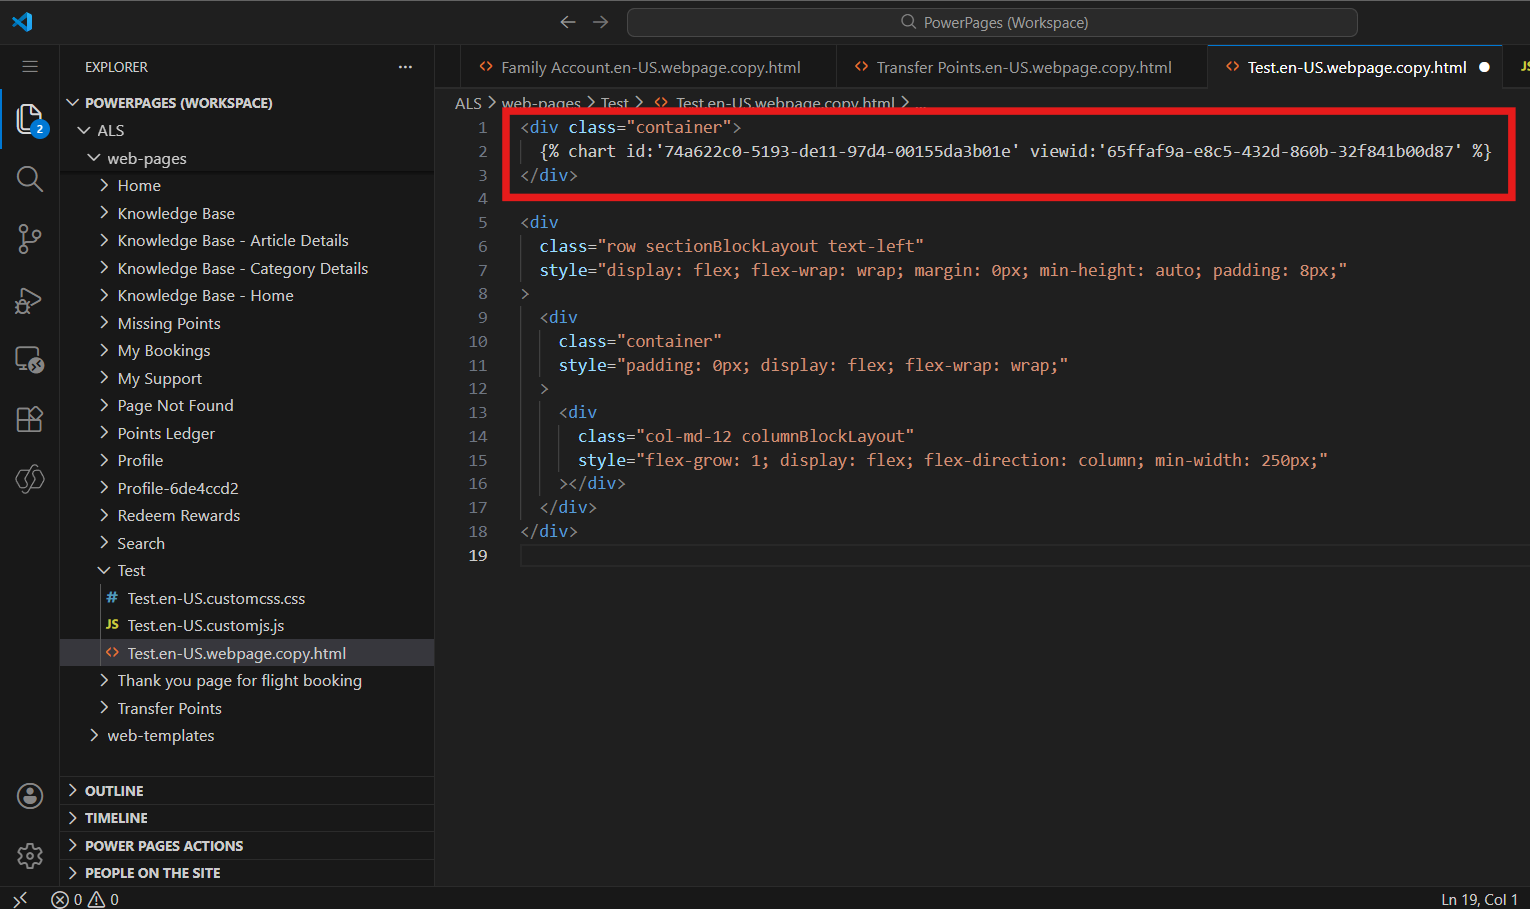
In VS Code, paste the following Liquid code: {% chart id:"YOUR_CHART_ID" viewid:"YOUR_VIEW_ID" %}, and save your changes.
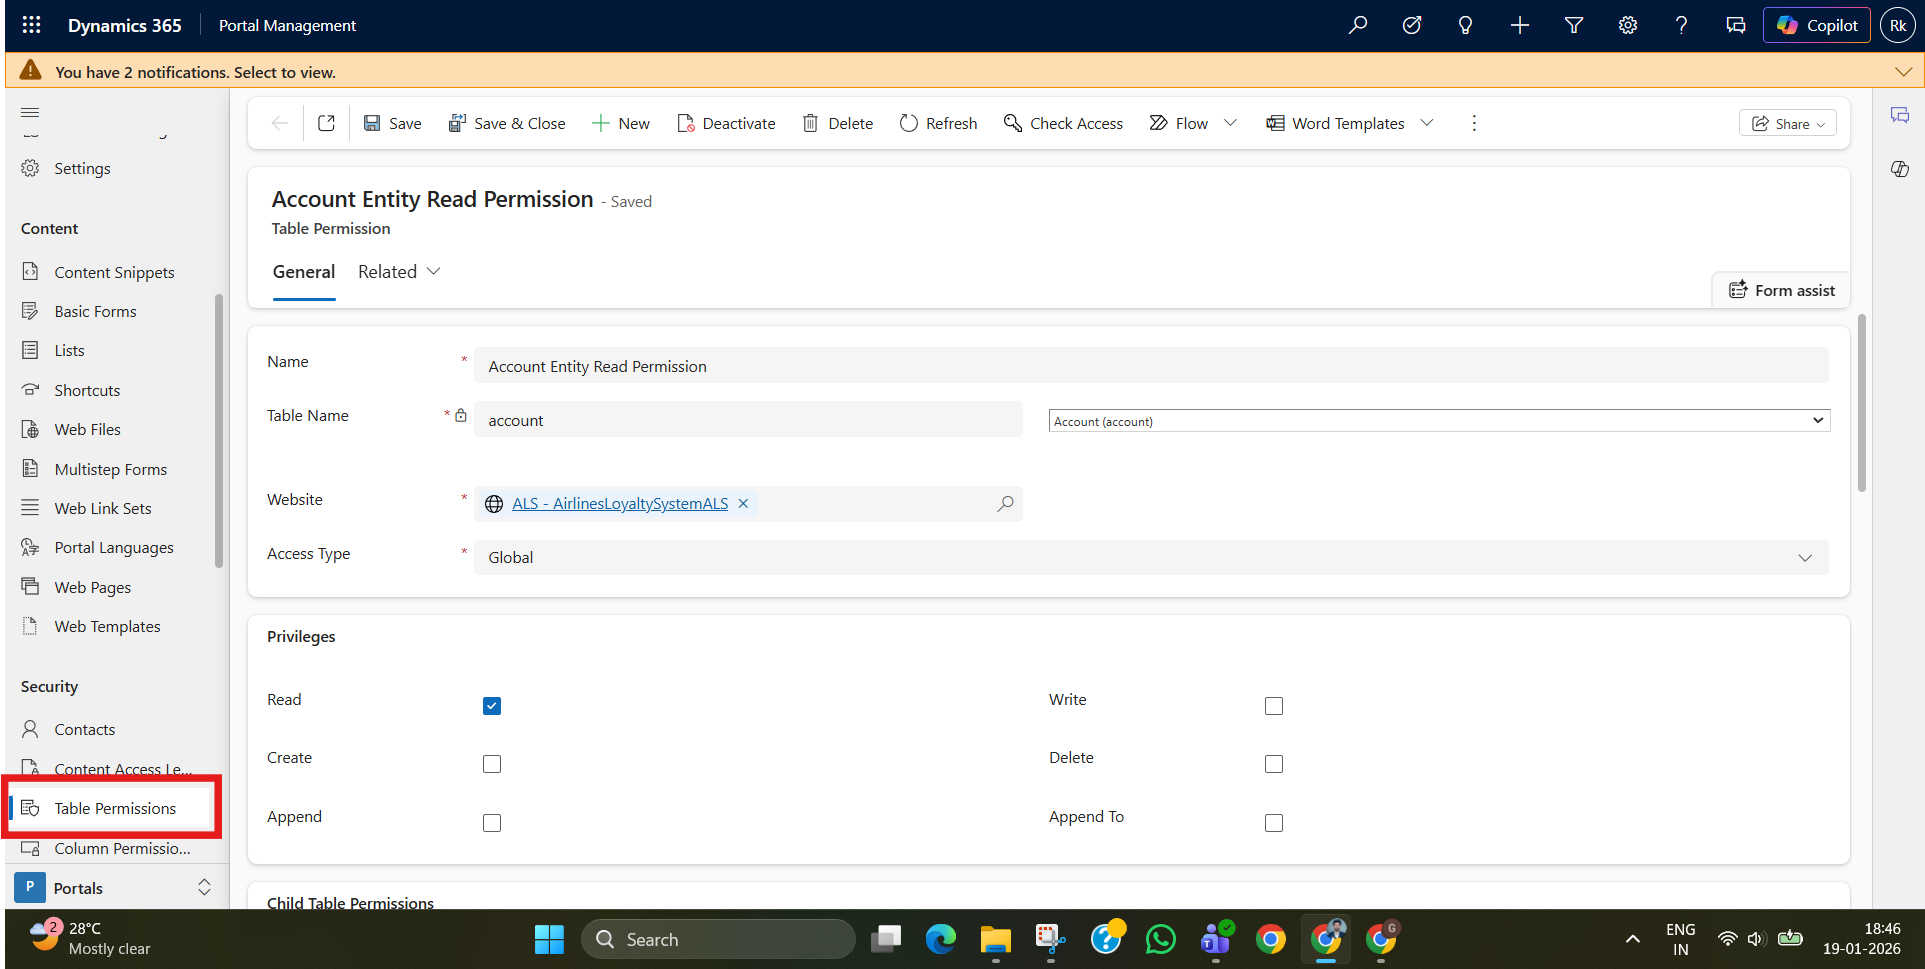
The chart requires read privileges for the target table being queried. Open Portal Management → Security → Table Permissions, create a Read permission for the target table, assign it to the required Web Role, and save.
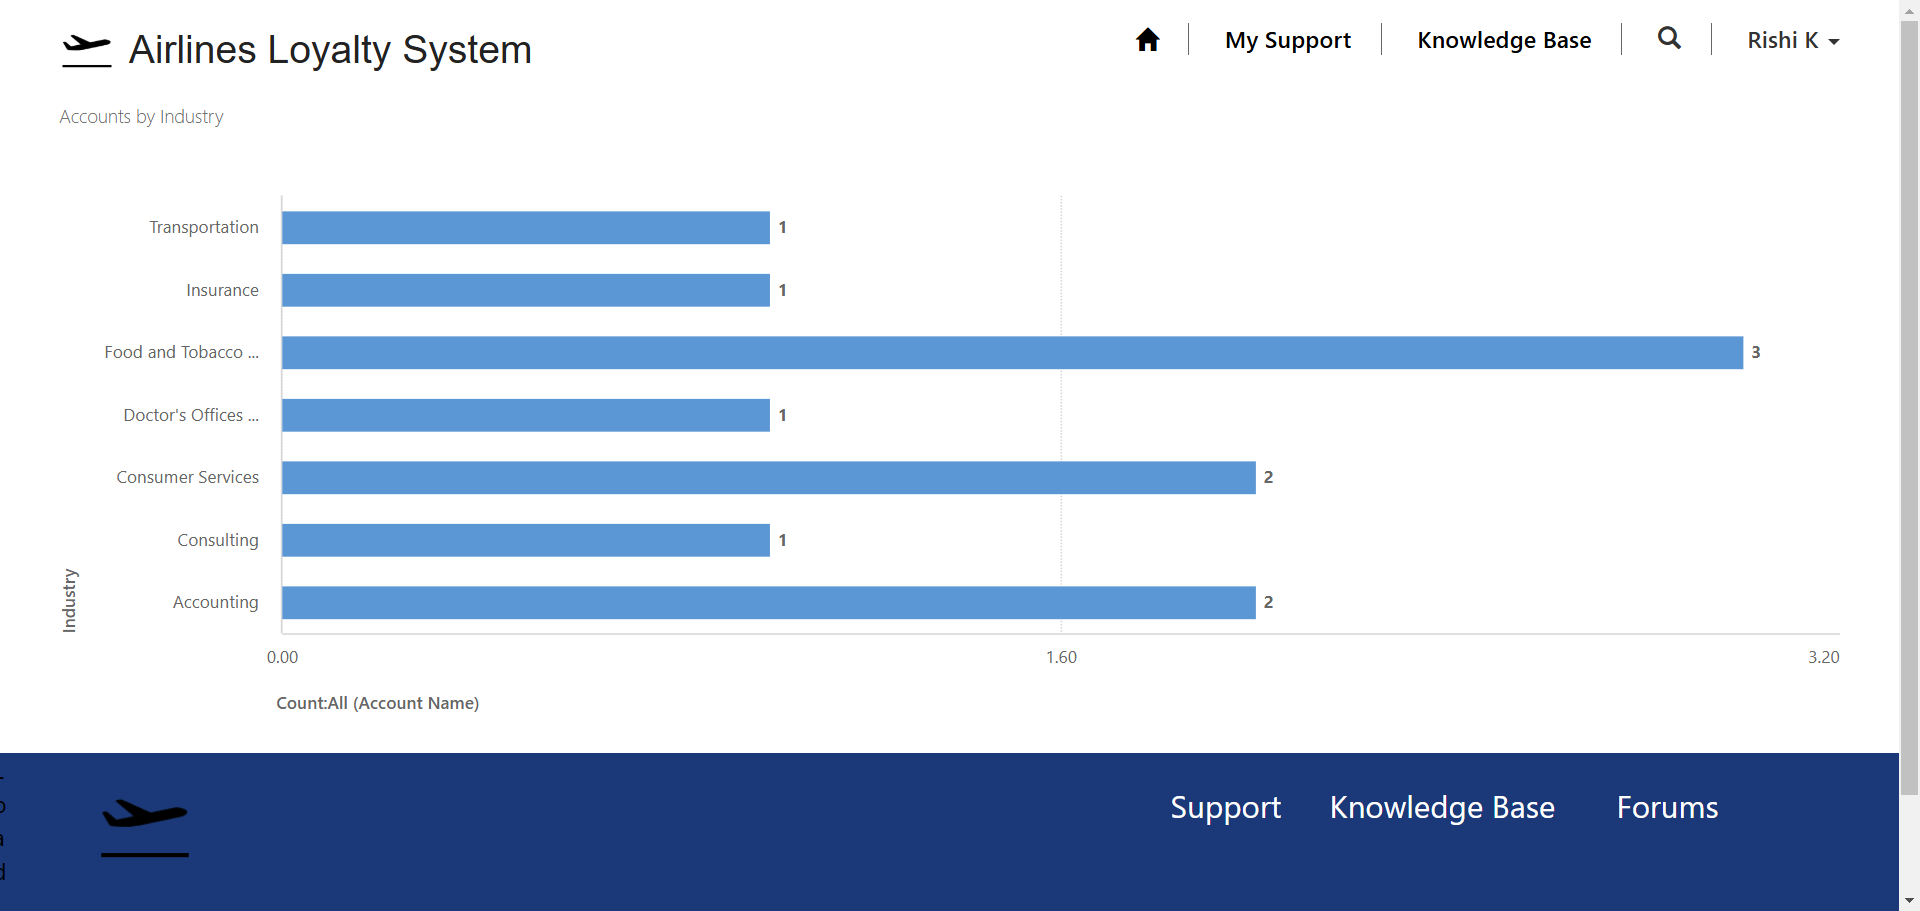
Sync the changes in Power Pages Studio, then preview the page—you should now see the chart rendered.
Now preview the portal page.
The chart renders with real-time data.
Users can access insights without requiring direct access to the CRM.
Embedding a model-driven app chart into Power Pages using Liquid code is a clean way to show real-time Dataverse insights inside your portal. By using the correct chart ID + view ID and configuring Table Permissions, you can deliver secure, dynamic dashboards to portal users—without exposing direct CRM access. However, avoid this approach when you need highly customized visuals, complex calculations, or interactive analytics beyond standard views and charts.
Frequently Asked Questions (FAQ)
1. What is the Liquid chart tag in Power Pages?
It’s a Dataverse Liquid tag that lets you render a model-driven app chart on a Power Pages webpage using the chart ID and the view ID.
2. Why do we need both Chart ID and View ID?
We need View ID to tell the system which data to fetch (filtered records), and Chart ID to tell it how to display that data (bar/pie/line, grouping, count, etc.).
3. How do I fix “Access Denied” for portal users?
Create Table Permissions with Read access for the table used by the chart and assign it to the correct Web Role.
4. Can I embed multiple charts on the same Power Pages page?
Yes—add multiple {% chart %} tags, each with its own Chart id and View id, and they will render one after another.
5. What if the chart still doesn’t load after adding permissions?
Recheck that the Chart ID and View ID are correct, and confirm the table permission is linked to the same website and web role used by the page.